[HAI5016] my-first-project
During previous class, we learned how to set up a development environment with Python and Visual Studio Code (VS Code) using the UV tool. We also created a new project folder called my-first-project in your Developer folder and initialized a Git repository.
What a few of you have been asking me is
“Professor, where can I find my
Developerfolder again?”.
Well, let’s address that first, and then continue with our first project.
Disclaimer: This blog provides instructions and resources for the workshop part of my lectures. It is not a replacement for attending class; it may not include some critical steps and the foundational background of the techniques and methodologies used. The information may become outdated over time as I do not update the instructions after class.
1. Place your ~/Developer folder in Favorites
To make it easier to access your Developer folder, you can add it to your Favorites (macOS) or Quick Access (Windows) in your file explorer.
On Windows
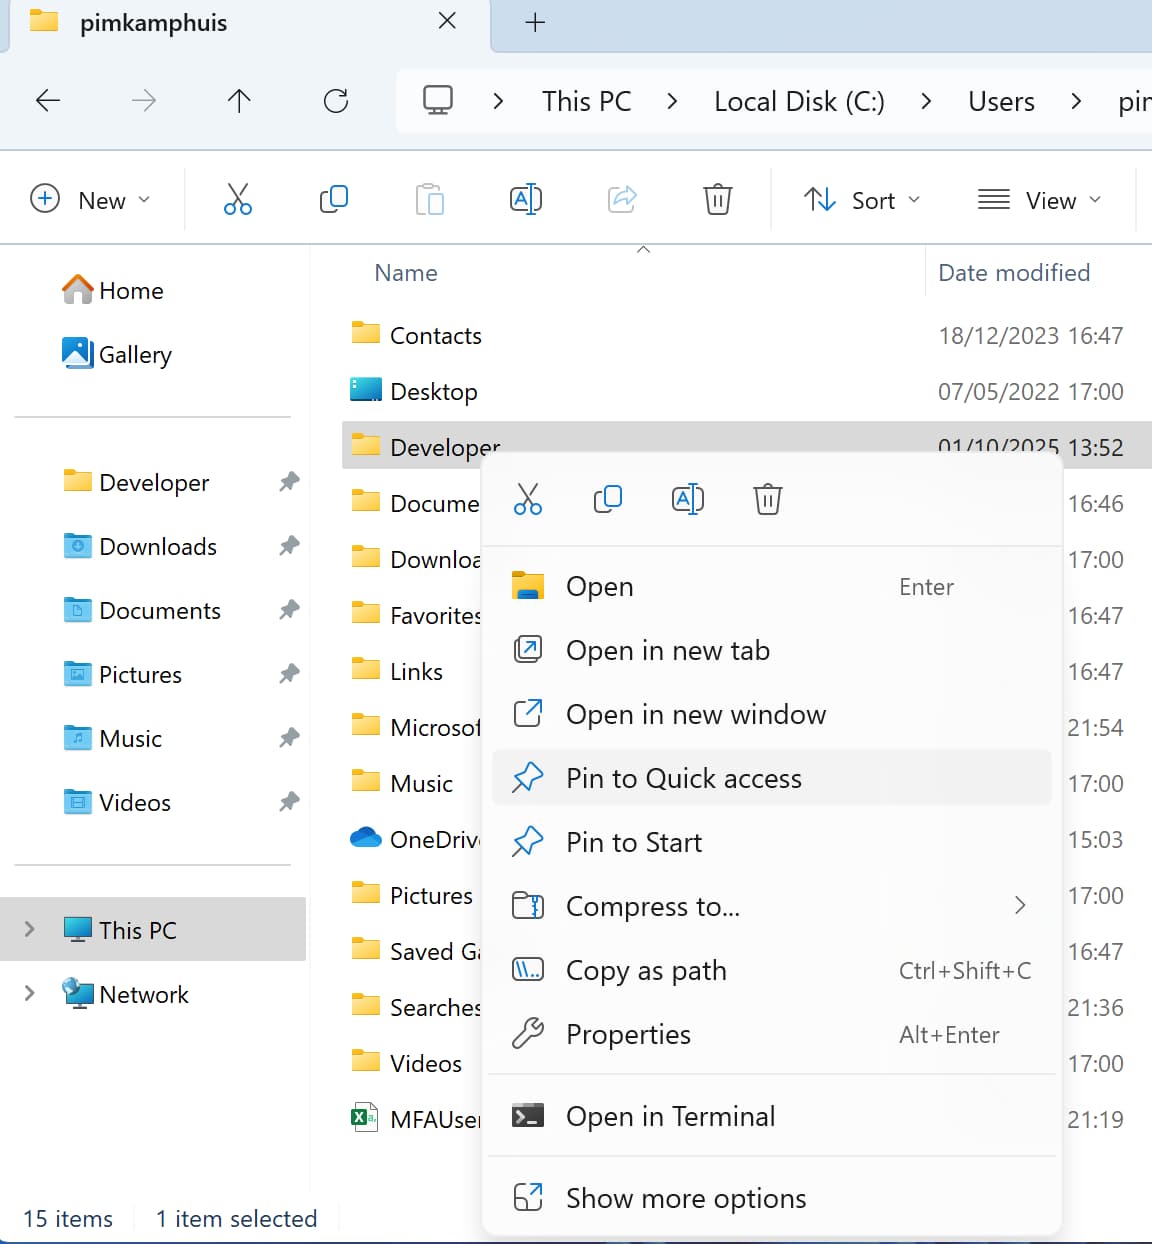
- Open File Explorer
- In the address bar, enter
%HOMEPATH%\and press Enter -
Right-click on the
Developerfolder in the address bar and selectPin to Quick accessLike with the
code .command to open the folder in your current terminal path in VS Code, you can also open your folder in explorer by typingexplorer .in the terminal.
On macOS
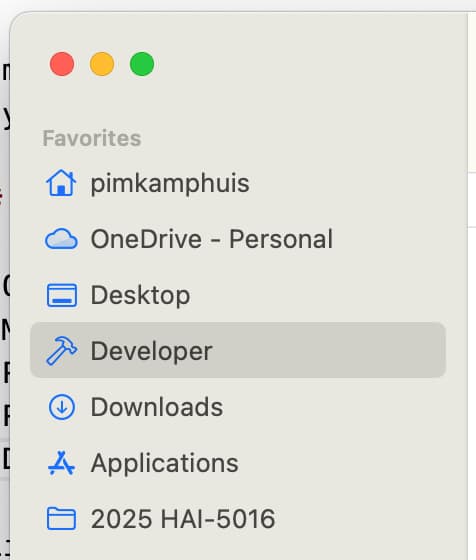
- Open Finder
- Press
CMD + Shift + Gto open the “Go to Folder” dialog - Type
~/to go to your home directory - Press Enter
-
Drag the
Developerfolder into FavoritesLike with the
code .command to open the folder in your current terminal path in VS Code, you can also open your folder in finder by typingopen .in the terminal.
2. Continue with my-first-project
Make sure that you created your my-first-project folder in the ~/Developer folder and set up a Python project using UV as described in the previous posts. Then you’re ready to continue and try today:
- Python code to download the titanic dataset from a URL and save it to a CSV file
- Jupyter Notebook to load the CSV file and explore the data
2.1 Open your my-first-project folder in VS Code
As you may remember, there are several ways to open a folder in VS Code. The easiest way is to use the terminal.
A: Open the folder in VS Code
- Open Visual Studio Code
- Go to file > Open Folder…
- Navigate to your
Developerfolder and select themy-first-projectfolder - Click on
Select Folder(Windows) orOpen(macOS)
B: Open the folder in VS Code using the terminal
- Open your terminal
- Navigate to your
my-first-projectfolder by typingcd ~/Developer/my-first-project -
Type
code .and press Enter to open the folder in VS Code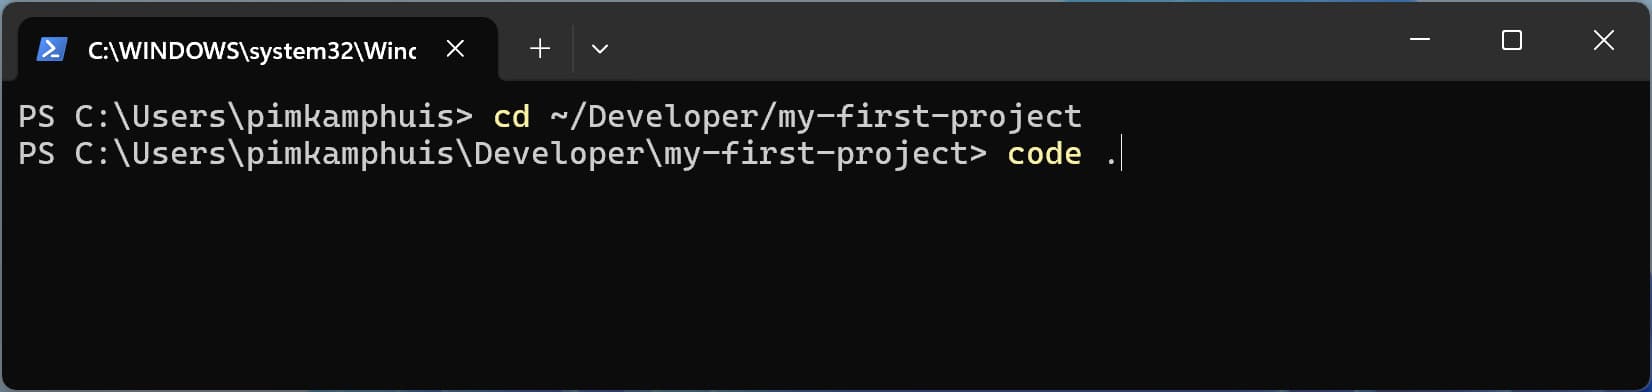 Opening your project folder in VS Code using the “code .” command in the terminal
2.2 Turn off your Copilot
Because I want you to get familiar with writing code yourself, please turn off GitHub Copilot for this exercise. In the bottom right corner of VS Code, click on the Copilot icon and select Disable Copilot from the menu, or press Snooze multiple times.
2.3 Make a Python script to download the Titanic dataset
From the VS Code File Explorer, use the New File icon to create a new python file named
download_data.py.-
Type (or copy + paste) the following code:
1
2
3
4
5
6
7
8
9
10
11
12
13
14

# Import the packages os and urllib.request
import os
import urllib.request

# Create a directory in our project folder if it doesn't exist
os.makedirs('titanic-data', exist_ok=True)

# Set the source URL and destination path
download_url = 'https://hbiostat.org/data/repo/titanic3.csv'
file_path = 'titanic-data/titanic3.csv'

# Download the file if it doesn't exist
if not os.path.exists(file_path):
   urllib.request.urlretrieve(download_url, file_path)
Let’s break down together in class what this code does
- Save the file (CTRL + S or CMD + S)
- Commit your changes to the repository
- Go to the Source Control tab in VS Code
- See which files have changed
- Write a commit message like “Add download_data.py to download Titanic dataset”
- Click on the checkmark icon to commit your changes
-
Run the script to download the data
Congratulations! 🎉. If this went well, there should be a new folder in your project called
titanic-datathat contains the filetitanic3.csv.
2.4 Add the data folder to .gitignore
- Open the source control tab in VS Code
- Find the
titanic3.csvfile in the list of changes - Right-click on the file and select
Add to .gitignore - Save the
.gitignorefile -
Commit your changes to the repository
This will add the
titanic-data/folder to your.gitignorefile, so that the data file is not tracked by git.
3. Explore the data in a Jupyter Notebook
Run the New Jupyter Notebook command from the Command Palette (
Ctrl+Shift+P) or by creating a new.ipynbfile in your project folder like you did before with the.pyfiles.Save the notebook as
titanic.ipynbby pressingcrtl+sorcmd+sClick on the kernel picker in the top right to select the Python environment you created for this project
- In the first cell, let’s set a title and description for our notebook using Markdown. Change the cell type to
Markdownusing the dropdown in the toolbar or by pressingMwhile the cell is selected.- Title: Titanic Dataset Exploration
- Description: This notebook explores the Titanic dataset and performs basic data analysis.
- In the new Python cell, type the same code as in our first Python script:
1
2

msg = "Hello World"
print(msg)
- Hit
Shift+Enterto run the currently selected cell and insert a new cell immediately below.
3.1 Load our data into a Dataframe
Let’s begin our Notebook journey by importing the Pandas and NumPy libraries, two common libraries used for manipulating data.
-
Copy and paste the following code into the first cell
1
2
3

# Import the pandas and numpy packages
import pandas as pd
import numpy as np
And hit
Shift+Enterto see if the libraries load successfully. - Then, let’s load the titanic data into the memory:
1
2

# Load the titanic dataset from the CSV file into a pandas dataframe
data = pd.read_csv('titanic-data/titanic3.csv')
-
Let’s see what the data looks like by showing the top 5 records in our dataframe:
1
2

# Show the top records in the dataframe
data.head()
-
Let’s get an overview of the columns and their data types:
1
2

# Show the data types of each column
data.dtypes
Explore the
VariablesandView databuttons that appeared in the editor.- Let’s replace the ‘?’ with missing data markers:
1
2
3
4
5

# Replace '?' with NaN (missing data marker)
data.replace('?', np.nan, inplace= True)

# Convert the age and fare columns to float64 data type
data = data.astype({"age": np.float64, "fare": np.float64})
- Let’s add a markdown cell to our Notebook with the meaning of several column names, so that we won’t have to look it up another time.
3.2 Visualize our data
With our data loaded into a dataframe, let’s use seaborn and matplotlib to view how certain columns of the dataset relate to survivability.
- Load the seaborn and matplotlib packages into the memory:
1
2
3

# Import the seaborn and matplotlib packages
import seaborn as sns
import matplotlib.pyplot as plt
If you get a
ModuleNotFoundError, you may need to install the packages into your Python virtual environment first by runninguv add seaborn matplotlibin your terminal. You find the terminal in VS Code in the lowest panel (or by going to View > Terminal). - Then, let’s write some code to visualize our data:
1
2
3
4
5
6
7

# Create subplots to visualize relationships between variables and survival
fig, axs = plt.subplots(ncols=5, figsize=(30,5))
sns.violinplot(x="survived", y="age", hue="sex", data=data, ax=axs[0])
sns.pointplot(x="sibsp", y="survived", hue="sex", data=data, ax=axs[1])
sns.pointplot(x="parch", y="survived", hue="sex", data=data, ax=axs[2])
sns.pointplot(x="pclass", y="survived", hue="sex", data=data, ax=axs[3])
sns.violinplot(x="survived", y="fare", hue="sex", data=data, ax=axs[4])
3.3 Calculate correlations
Visually, we may see some potential in the relationships between survival and the other variables of the data. With the pandas package it’s also possible to use pandas to calculate correlations, but to do so, all the variables used need to be numeric for the correlation calculation. Currently, sex is stored as a string. To convert those string values to integers, let’s do the following:
Check the values with
data['sex']- Map the textual values with integers:
1
2

# Map 'male' to 1 and 'female' to 0
data.replace({'male': 1, 'female': 0}, inplace=True)
Ceck the values again with
data['sex']. The sex column should now consist of integers instead of strings.- Now we can correlate the relationship between all the variables and survival:
1
2

# Calculate the absolute correlation of all numeric columns with the 'survived' column
data.corr(numeric_only=True).abs()[["survived"]]
- Which variables seem to have a high correlation to survival and which ones seem to have little?
Let’s say we think that having relatives is related survivability. Then we could group sibsp and parch into a new column called “relatives” to see whether the combination of them has a higher correlation to survivability.
- To do this, you will check if for a given passenger, the number of sibsp and parch is greater than 0 and, if so, you can then say that they had a relative on board:
1
2
3

# Create a new column 'relatives' that indicates if a passenger had any siblings/spouses or parents/children aboard
data['relatives'] = data.apply (lambda row: int((row['sibsp'] + row['parch']) > 0), axis=1)
data.corr(numeric_only=True).abs()[["survived"]]
References
- VS Code Data Science Tutorial
- VS Code Tips & Tricks
- 10 essential VS Code tips & tricks for greater productivity